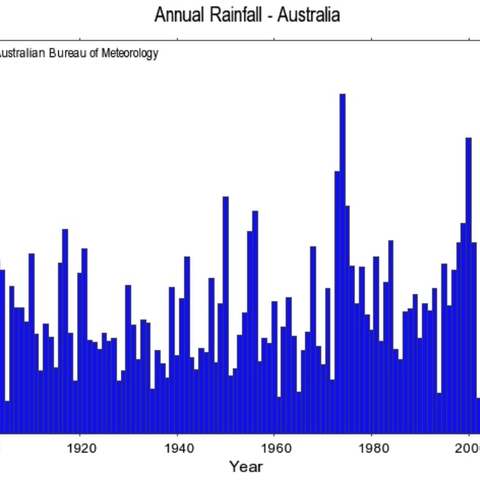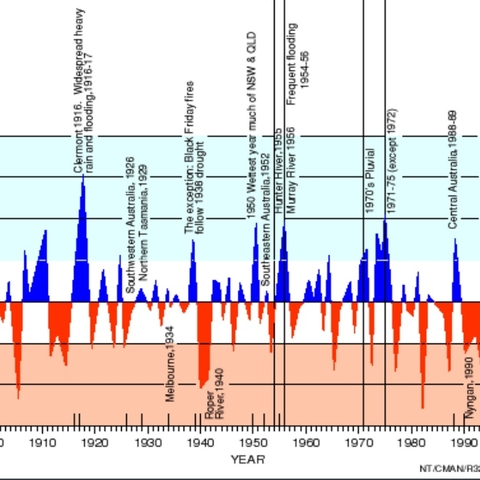
The Southern Oscillation Index, Differential from Average Atmospheric Pressure in the Oceans surrounding Australia during periods of El Nino and La Nina Weather Patterns
Source: Australian Bureau of Meterology
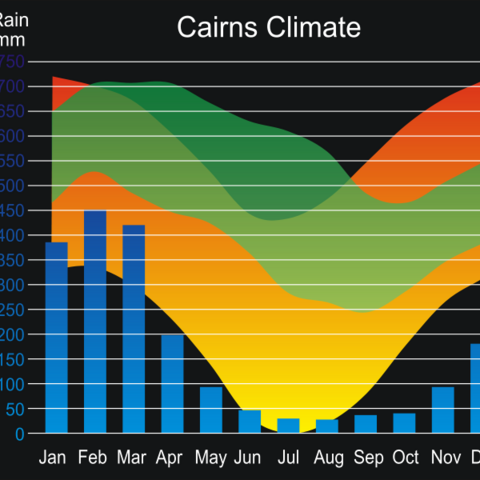
Graph Showing the Weather in Cairns, Queensland, with Blue bars showing Rainfall, Green zones showing Humidity, and Red zones showing Temperature
Source: Australian Bureau of Meterology
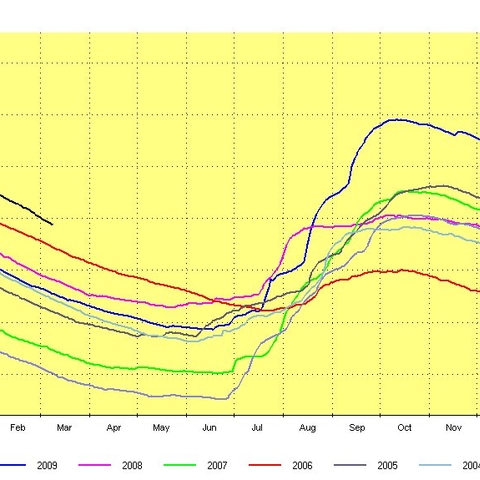
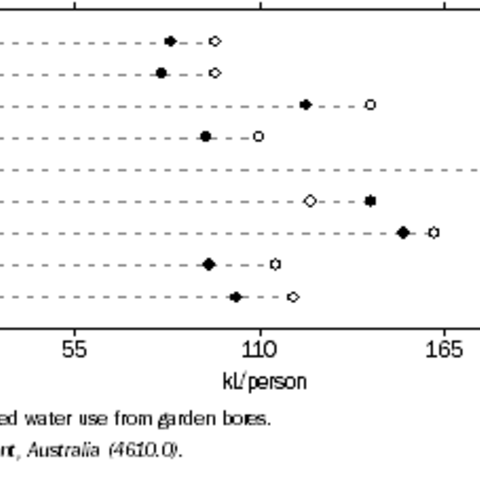
Chart showing the Storage Capacities of Australian Dams over the past decade
Source: Australia Bureau of Statistics
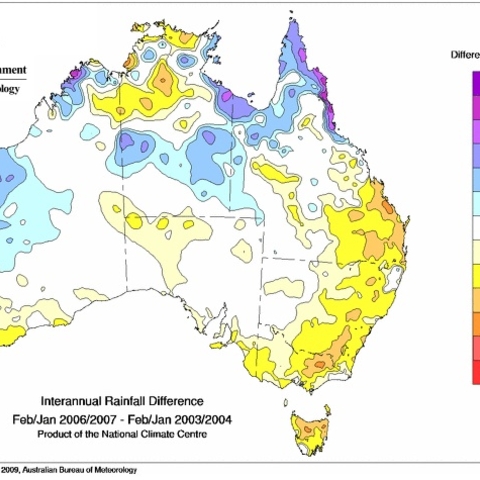
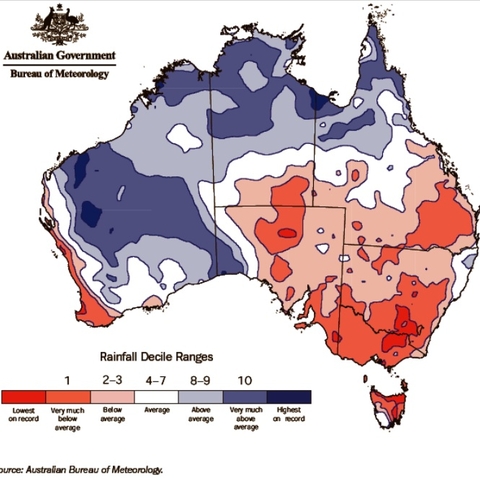
Map of Australia Showing the Three Year Difference in Rainfall Totals, 2004-2007
Source: Australia Bureau of Statistics
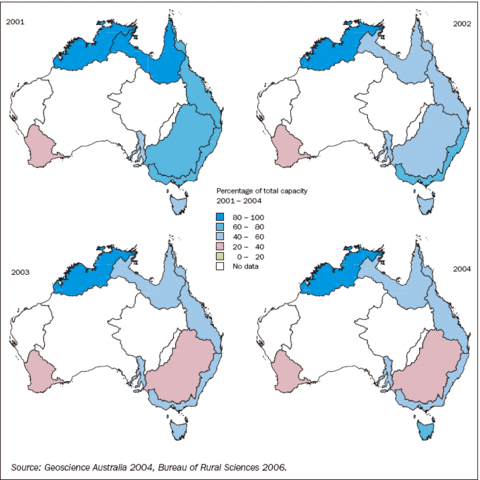
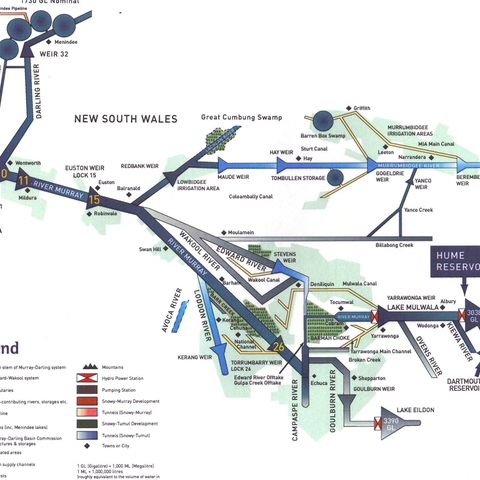
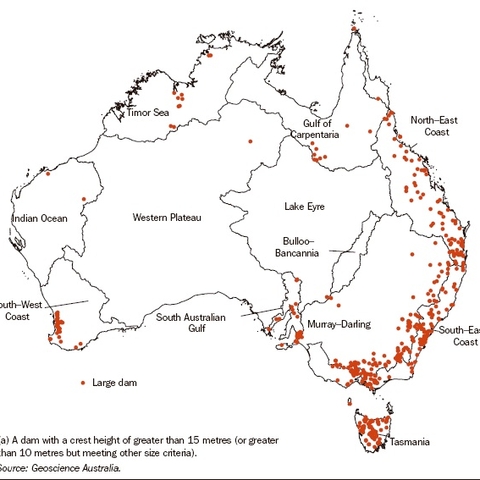
Maps showing Dam and Water Capacity in Australia in the 2000s
Source: Australia Bureau of Statistics
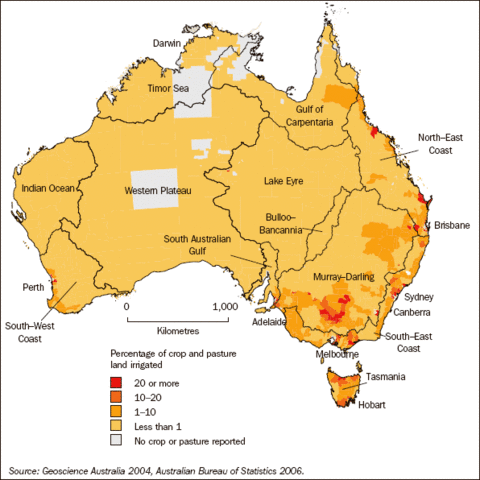
Map showing the percentage of Irrigated Land in Australia in 2004
Source: Australia Bureau of Statistics
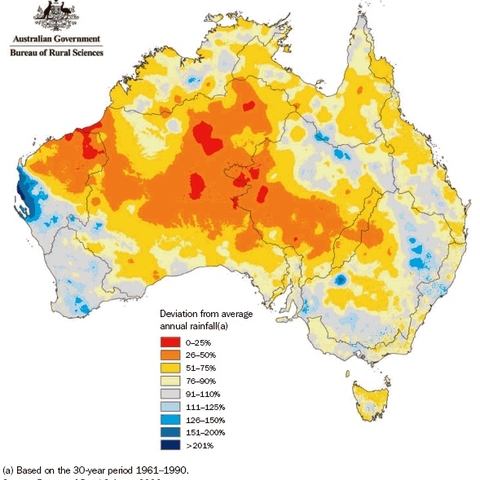
Map showing Drought Conditions in Australia in the past Decade
Source: Australia Bureau of Statistics
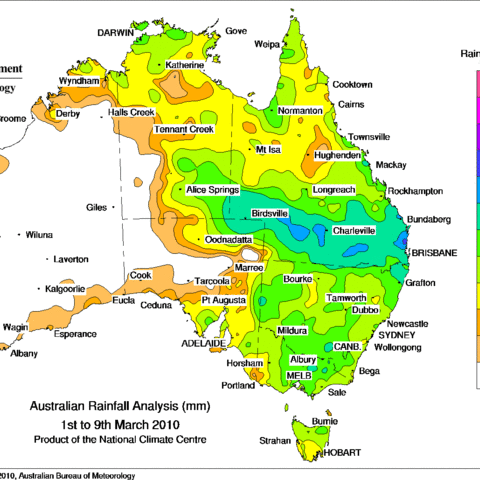
Map showing the Amount of Rainfall in Australia in early March 2010
Source: Australia Bureau of Statistics
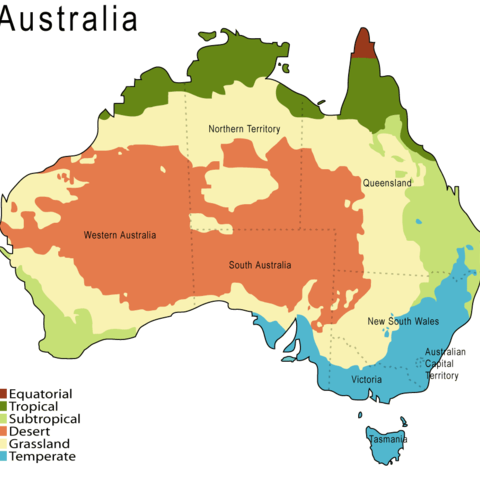
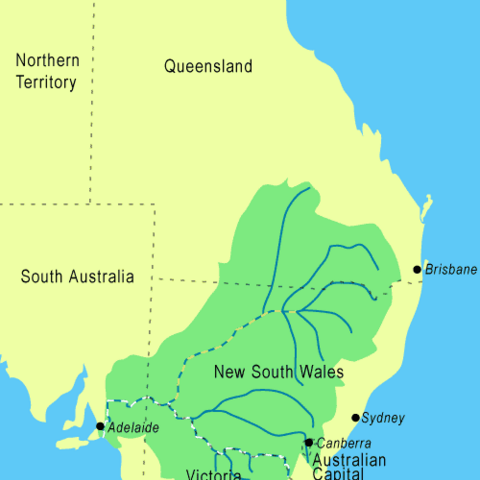
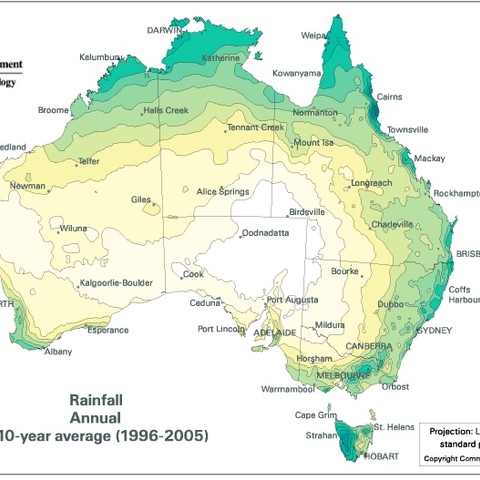
A Climate Map of Australia based on the Australian Bureau of Meterology
Source: Australian Bureau of Meterology

