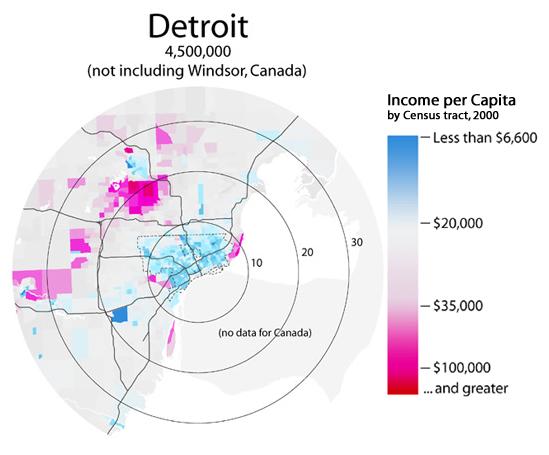
Detroit Metropolitan Map that shows, by color, income per capita in 2000. Notice how the income generally increases the farther one gets from the center of Detroit.
Source: wikipedia.org

The State of Michigan. The Detroit Metro Area is near the southeast (bottom right) corner.
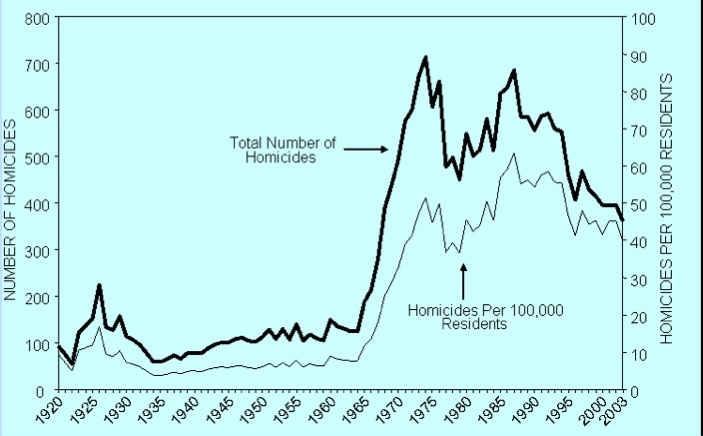
Chart showing the number of homicides in Detroit, by total and per capita numbers. Note the sharp increase accompanying the riots in the late 1960s.
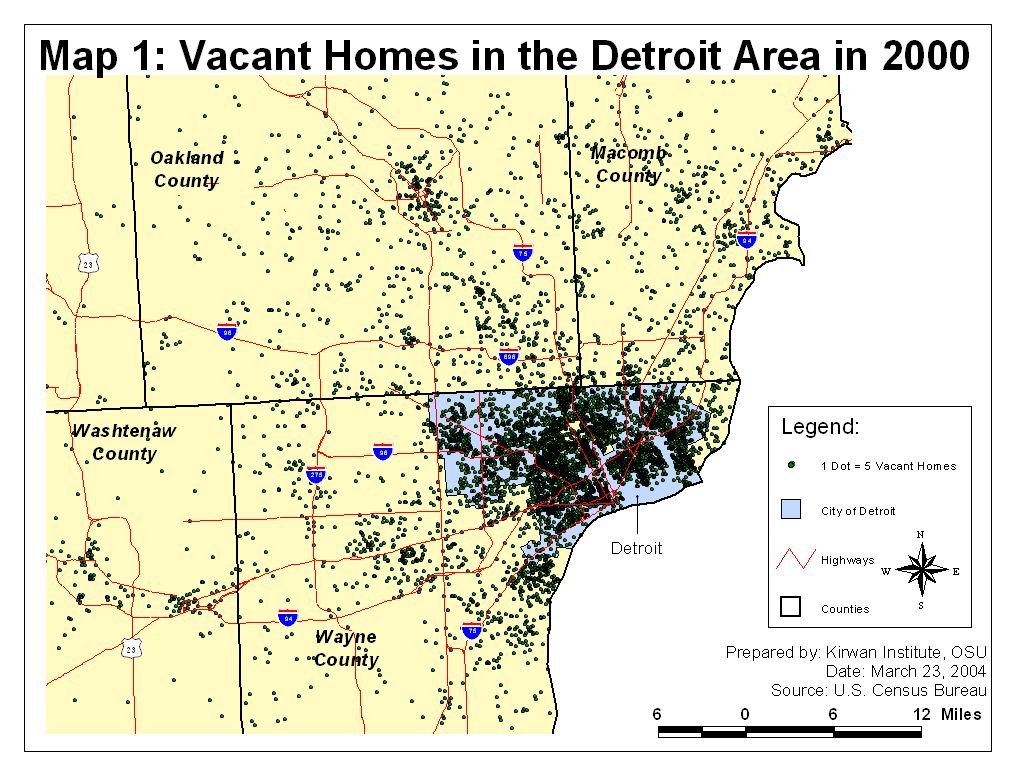
Detroit Map that shows the prevalence of vacant homes in 2000.

Census Tract Map of Detroit
Source: U.S. Census, edited by editor
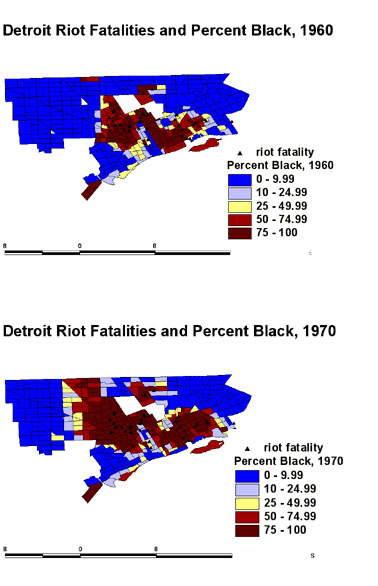
Two Maps of Detroit, showing the concentration of the African-American Population in 1960 and 1970, with the locations of deaths during the 1967 riots
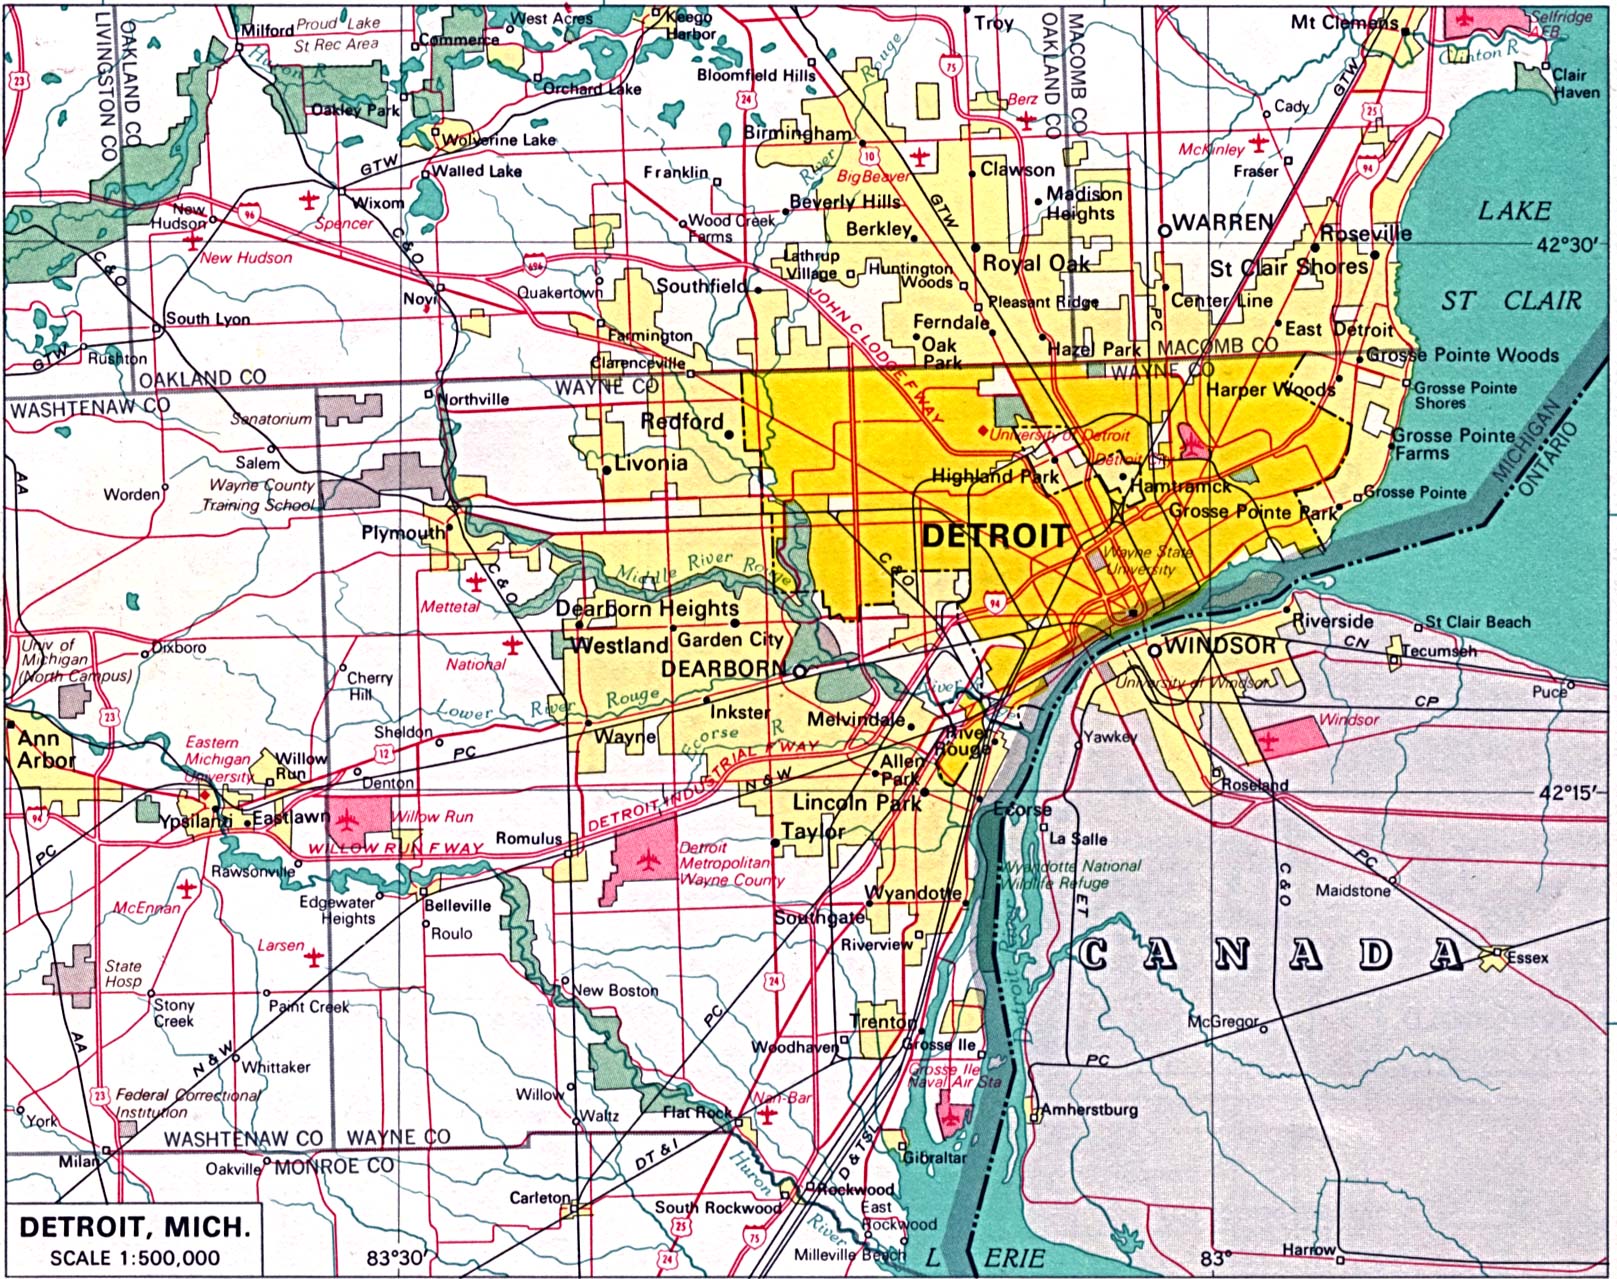
Urban Map of Detroit
Source: Perry Castenada Map Library at the University of Texas

Chart showing the Population of Detroit and its two related statistical areas for the 20th Century
Source: U.S. census, chart by editor.

Percentage of those who live in poverty, by age, in Michigan, Detroit, and Detroit's three main counties, 2000.
Source: U.S. census, chart by editor.

Percentage of Population in Detroit by Race, 2000.

Chart showing different educational characteristics of the Detroit metropolitan areas
Source: U.S. census, chart by editor.

Chart showing the high level of residential segregation in Detroit. Notice the slight dip in the last decade, which results from African-Americans moving out of the city of Detroit
Source: U.S. census, chart by editor.

Racial Composition of Detroit, 1970
Source: U.S. census, chart by editor.

Racial Composition of Detroit, 1980
Source: U.S. census, chart by editor.

Racial Composition of Detroit, 1990
Source: U.S. census, chart by editor.

Changes in Racial Compositon of the Three County Detroit Metro Area, 1970 to 2000.

Detroit Maps comparing unemployment rates and income with the location of fatalities during the 1967 riots
Source: Rutgers 1967 Riot Project