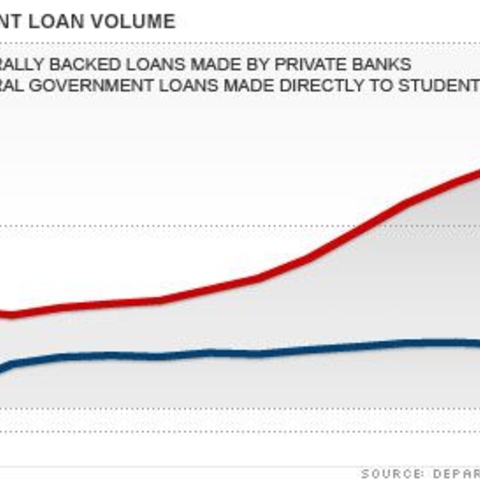
The proportion of private direct loans to government-backed loans, 1994-2009
Source: Department of Education
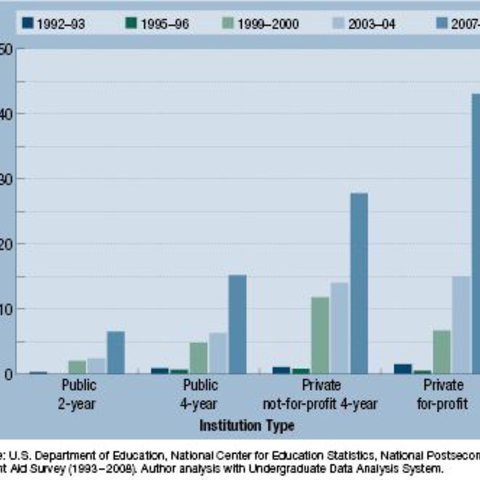
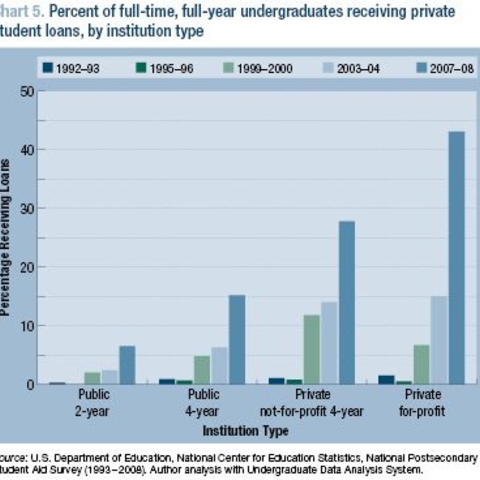
Percent of Full-Time, Full-Year Undergraduates Receiving Private Student Loans
Source: U.S. Department of Education
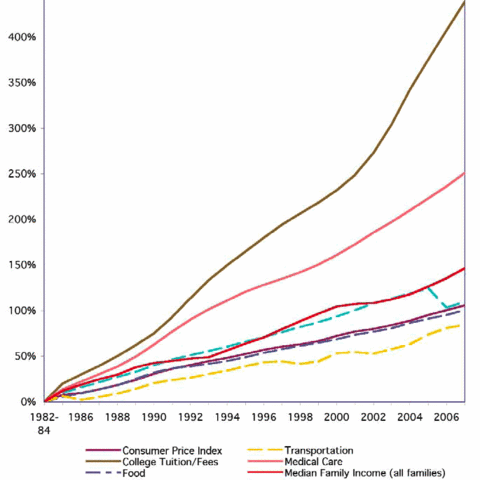
Chart showing the percentage increase of different costs in the United States, 1982-2008, including the dramatic increase in college costs

