
Chart that shows sizes of catches and number of ships.
Source: UNFAO, Fisheries and Aquaculture Department, “Global Capture Production, 1950-2005,” www.fao.org

World Map that shows the U.S. share of global EEZs
Source: Licensed under Creative Commons through wikipedia.org by "Lasunncty"
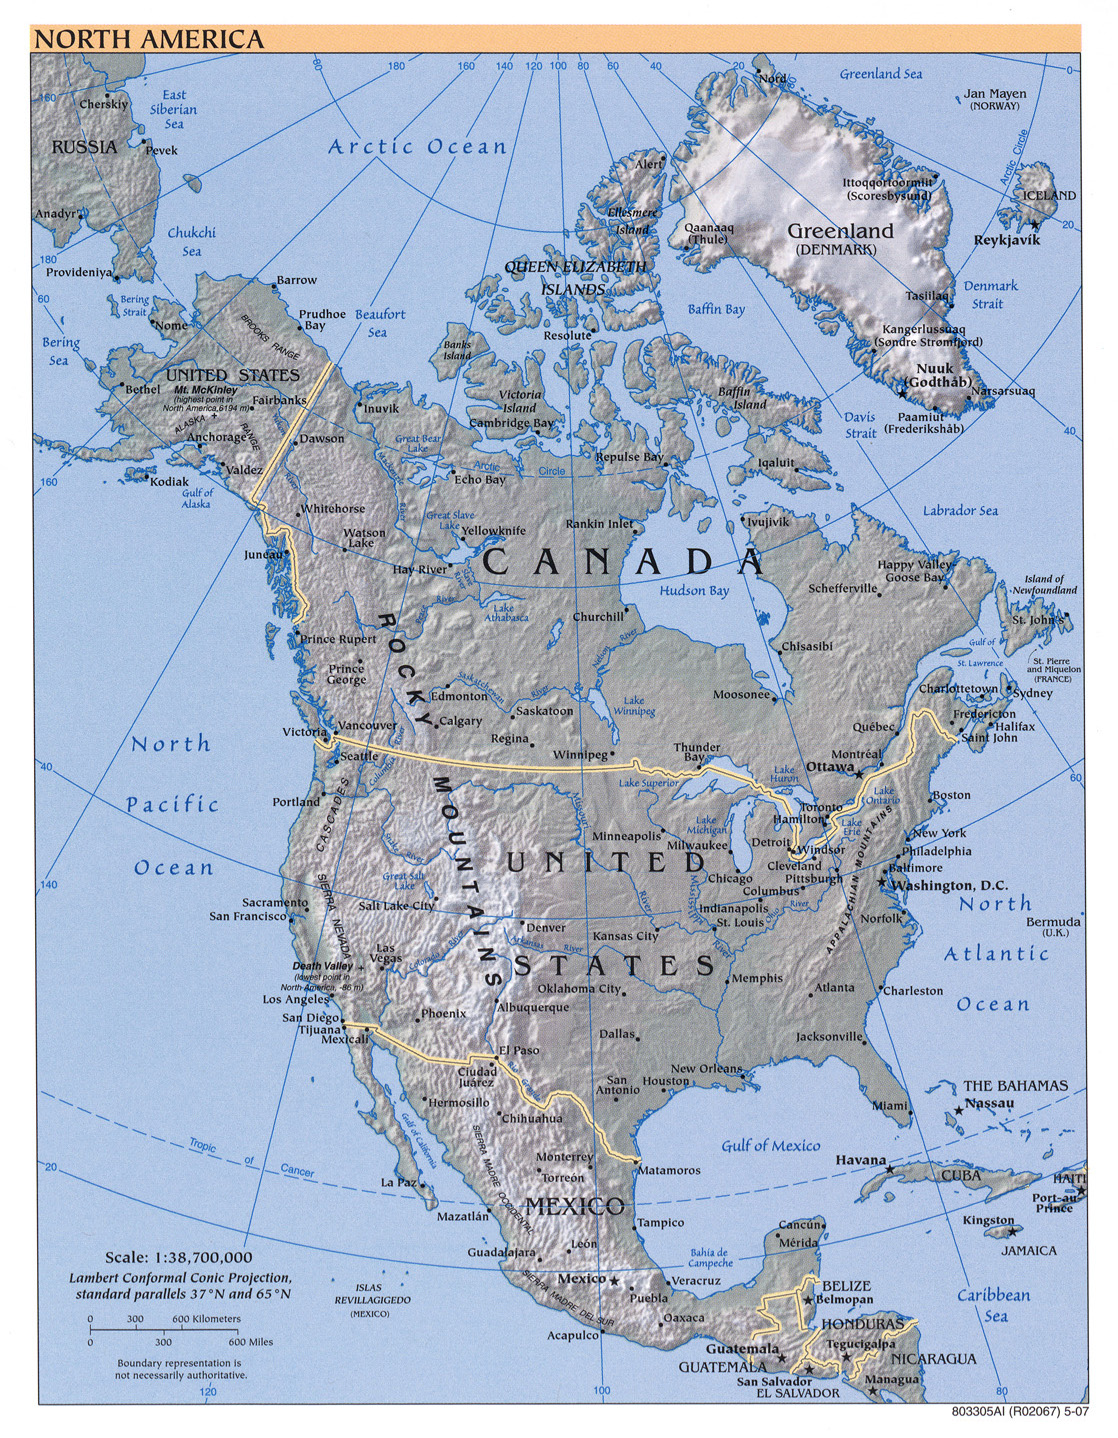
North America Map, showing the Northwest Atlantic and Northeast Pacific
Source: Perry Castenada Map Library
