Source: Creative Commons License (Lokal Profil)
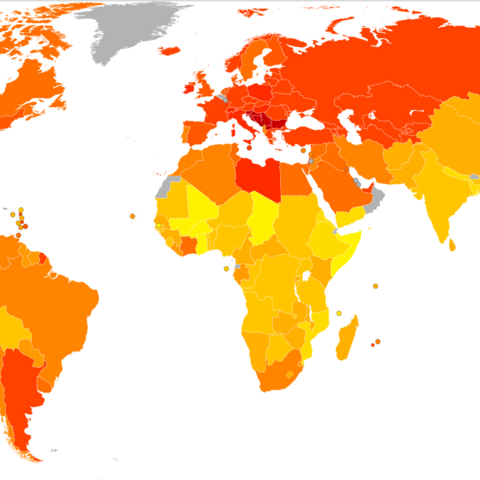
Source: Creative Commons License (Lokal Profil)
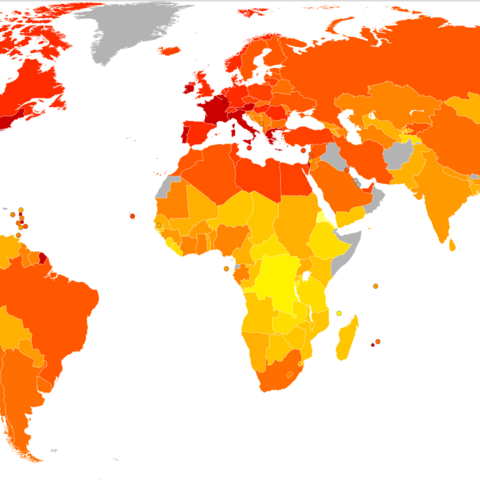
Source: GNU License (Lokal Profil), from FAO World Report Data

Source: Creative Commons (Jmh649)
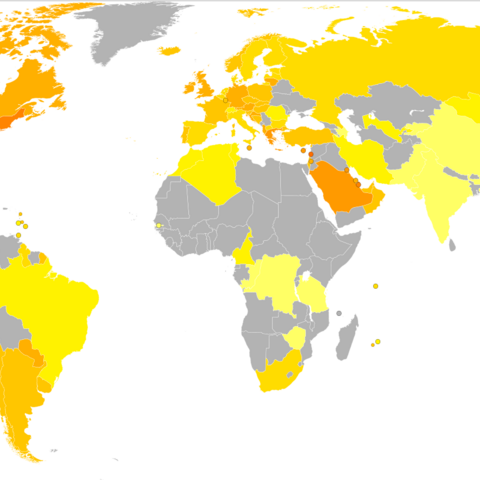
Source: Creative Commons License (Lokal Profil)
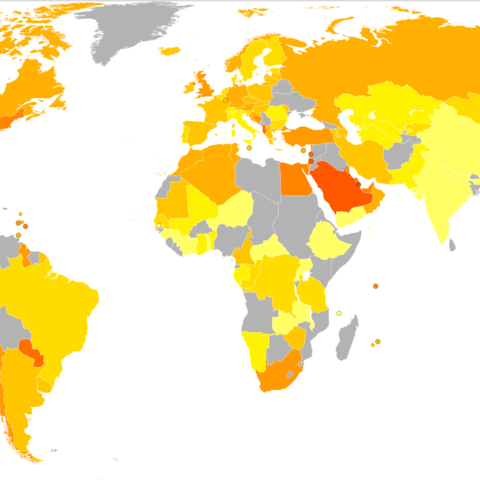
Source: Creative Commons License (Lokal Profil)
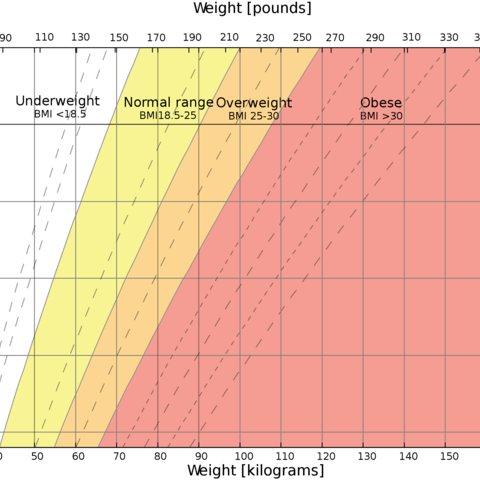
Source: Public Domain
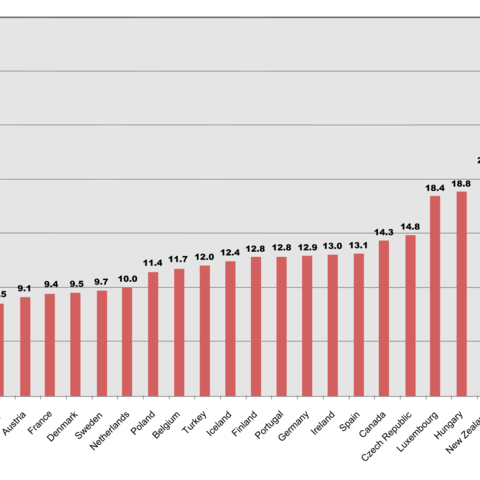
Source: OECD Factbook
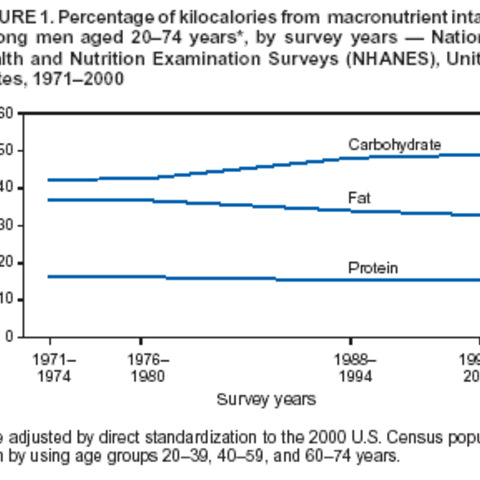
Source: U.S Department of Health and Human Services
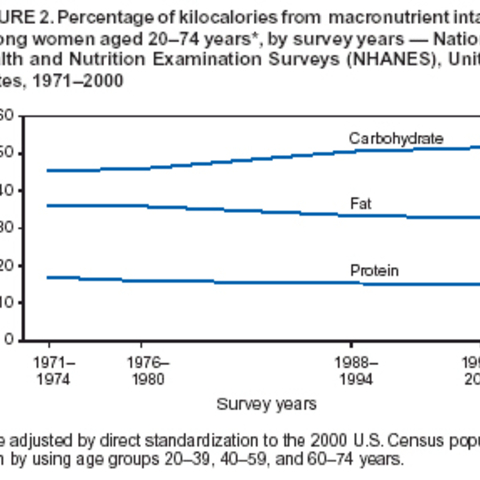
Source: U.S. Department of Health and Human Services
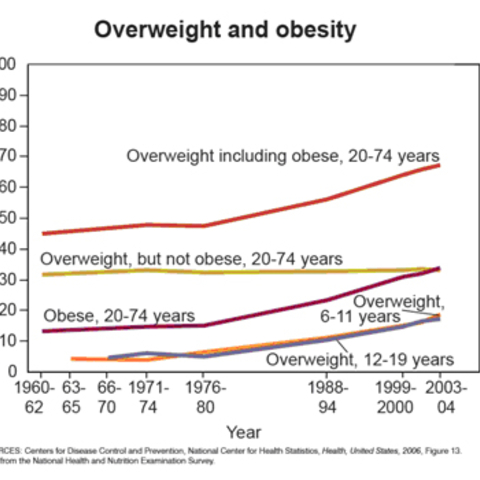
Source: Center of Disease Control
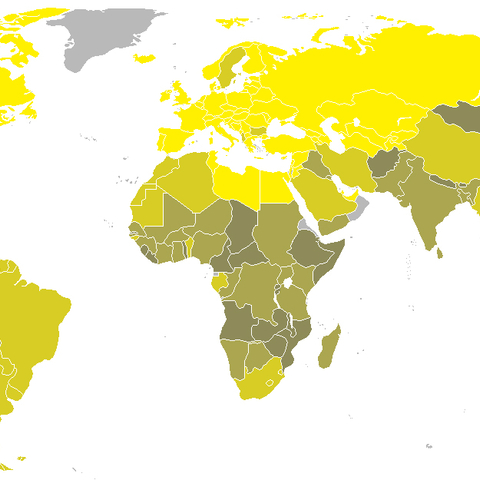
Source: Creative Commons (Interchange 88)
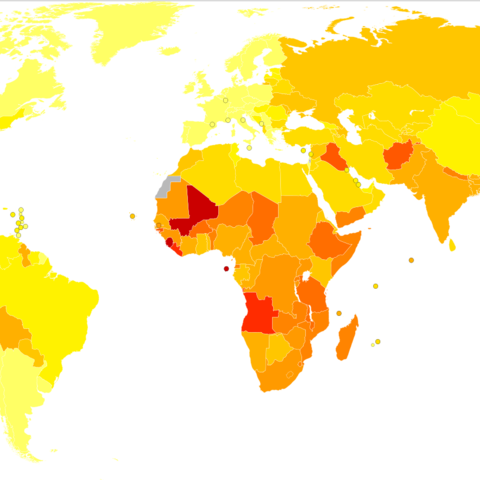
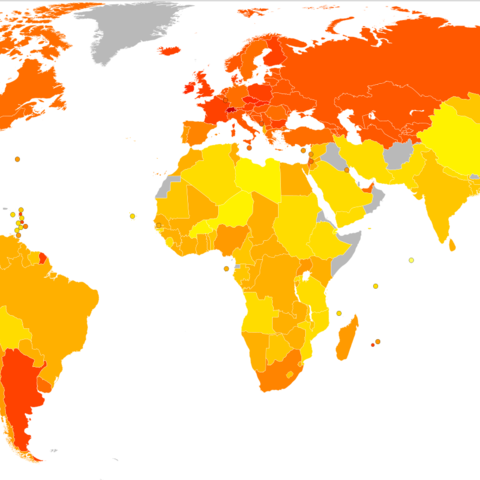
Age standardized disability-adjusted life year (DALY) per country, a measure of health that incorporates mortality and morbidity. Ranging from Light Yellow (less than 150 years of life lost) to Dark Red (over 1750 years of life lost) per 100,000 inhabitants by World Health Organization
Source: GNU License (Lokal Profil)
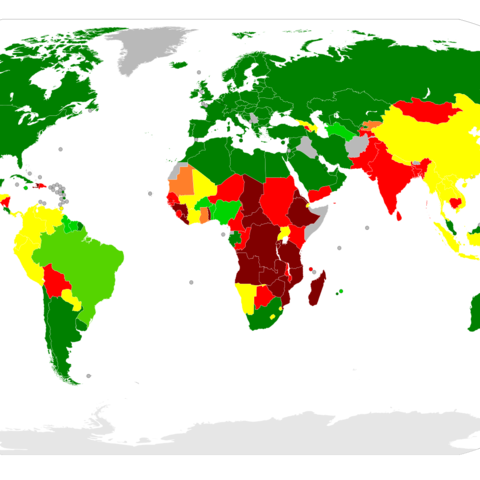
Source: GNU License (user Lobizon)
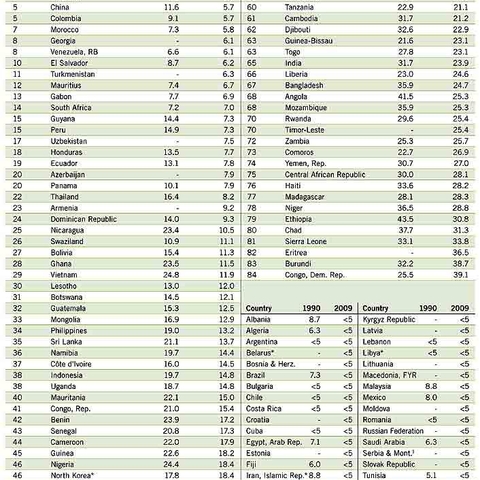
Source: GNU License (Welthungerhilfe)
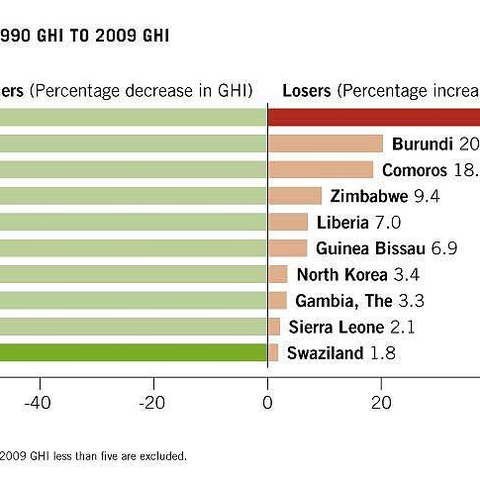
Source: GNU License (Welthungerhilfe)

